


WebGIS is an open data service for the territory in order to allow us to expand the offer of knowledge of data processed thanks to Remote Sensing
Participant in NASA's TOPS Open Science 101 training initiative for community open data science
 https://orcid.org/0009-0006-0934-6202
Support my projects
Project n.1
GeoFireGuard
(click on the image)
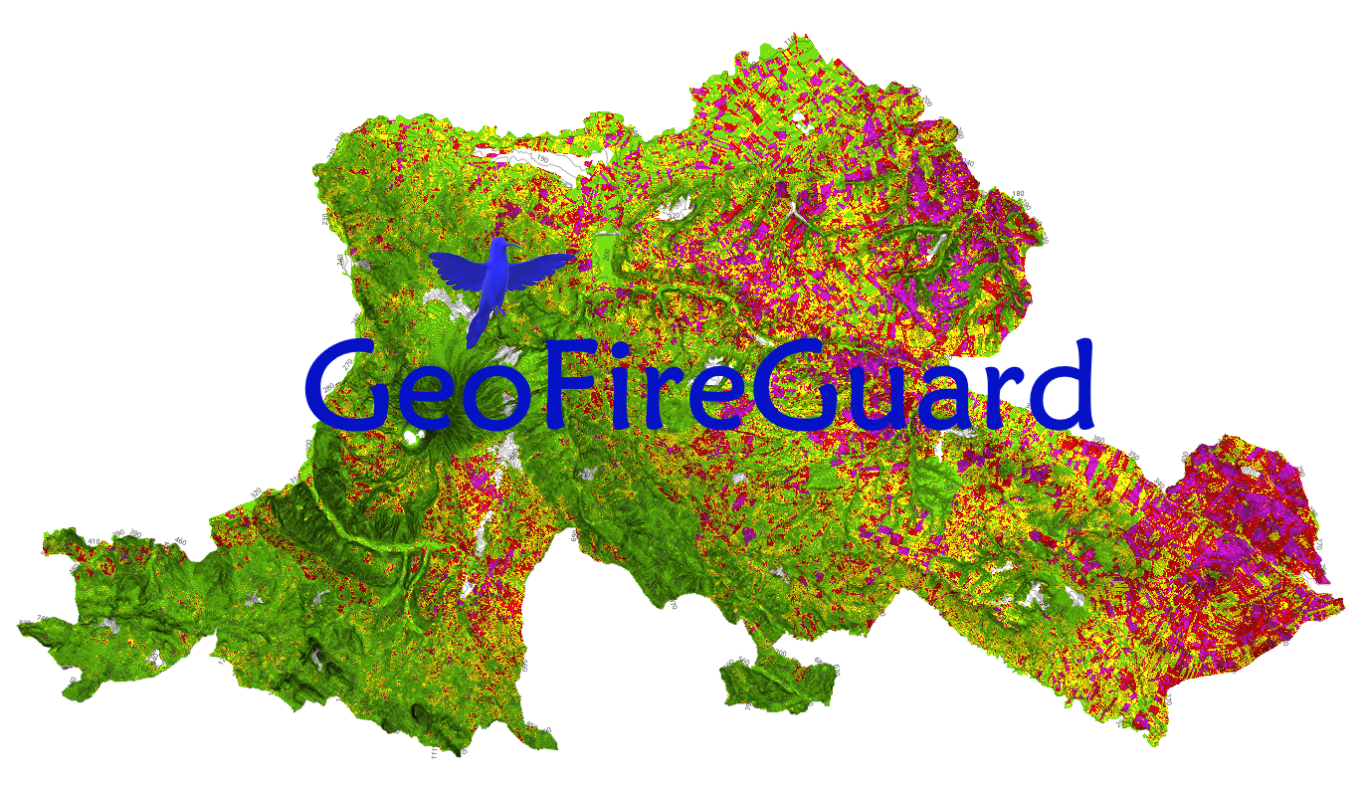
From the need to provide increasingly updated data on natural and anthropogenic risks caused by the climate crisis, the first project called GeoFireGuard was born, the open data service for monitoring and protecting areas at risk of fire, thanks to the processing of geospatial data made available available from the Sentinel constellations of the Copernicus program of the European Union and Landsat from the USGS/NASA.
In order to contribute to the fight against fires, maps and services are provided for the Vulture - Alto Bradano area (North Basilicata): NASA FIRMS fire service in near real time and focal point archive (fire nrt), supervised classification intensity and severity of fires, areas covered by fire and degree of burn, soil humidity, aridity and temperature of the earth's surface. Additional services have been integrated such as air pollution from sulfur dioxide (SO2), the GeoAI model on the spread of fires from agricultural fields, biogeophysical products.
Pollution from sulfur dioxide or sulfur dioxide (SO2)
- Calculated the atmospheric concentration maps of sulfur dioxide (SO2) obtained through the analysis of data from the Sentinel-5P satellite of the Copernicus program. Data processed with Google Earth Engine (GEE) with the following time frame: 4 July - 4 August - 4 September - 4 October 2023. Density of the vertical column of SO2 on the ground calculated with the DOAS technique. Unit of measurement: mol/m^2 (numbers of moles of a substance per square meter of surface) 1 mole of SO2 = 64, 0638 g/molAverage value detected in Basilicata: 0.004344449 g/molMax value detected Vulture Alto-Bradano: 0.03559215 g/molMin value detected Vulture Alto-Bradano: -0.02603678 g/molThe max and min values of SO2 are standard values that reflect the typical range of SO2 concentrations in the troposphere and are able to show significant changes in sulfur dioxide over time.
GeoAI model on fire spread
- The Boschifire Risk Assessment Model (BRAM) has been calculated, an experimental predictive model on the risk of fires spreading from agricultural fields towards woods and forests. The combined use of SAM and Random Forest algorithms to identify forest areas close to field fires - due to the obsolete practice of stubble burning - is based on a supervised Random Forest classification of the RBR (Relativized Burn Area) index, from Sentinel-2 satellite images of the Copernicus program, and related short-wave infrared RGB image (spectral bands 12, 8 and 4) of 4 October 2024 specially segmented thanks to GeoAI (Artificial Intelligence). Sentinel-2B /11Jul2023 and Sentinel-2A /4Oct2023 images. Citation: luisCartoGeo, & luisChr. (2023). luisCartoGeo/GeoAI_Plugin: v1.0 GeoAi (GEOAI). Zenodo. https://doi.org/10.5281/zenodo.8313393
Fire danger and risk (before)
- NDWI (Normalized Difference Water Index) change detection calculation on soil humidity which returns increased, reduced and unchanged humidity values for a given time interval. Calculation of the NDWI index (Normalized Difference Water Index) on soil moisture which, if compared to the LST and RBR indices, can be useful in predicting areas at risk of fire, as well as supporting investigations by the relevant bodies. Soil Moisture Calculation (Sigma0_VV Intensity_db) for the measurement of backscattering on changes in the moisture content of soils and vegetation. Calculation of the BSI index (Bare Soil Index) on the aridity of the soils which when compared with the burned areas and the humidity of soils, returns useful information on the degradation of cultivated and forestry surfaces affected by fire. NDVI (Normalized Difference Vegetation Index) change detection calculation on changes in agro-forestry biomass (areas affected by fire, forestry operations, agricultural activities). NDVI index calculation on the quantity and health of the vegetation. Calculation of the TVI index (Transformer Vegetation Index) on biomass stressed by drought. Calculation of the areas at risk of fire with a method of visual representation of the areas with greater or lesser risk, based on the threshold values defined by the indices NDVI, EVI, NDWI and NBR.
Fire monitoring (during)
- NASA FIRMS “Near Real Time” Fire Service The Fire Information for Resource Management System (FIRMS) distributes active fire data in near real time (NRT) from the Moderate Resolution Spectroradiometer (MODIS) on board the Aqua satellites and Earth and by the Visible Infrared Imaging Radiometer Suite (VIIRS) aboard Suomi-NPP, NOAA-20 and NOAA-21 (formally known as JPSS-1). Globally this data is available within 3 hours of satellite observation, but for the United States and Canada active fire detections are available in real time.
Mapping of burned areas (after)
- Focal point archive (fire nrt) from 18 July to 4 October 2023 from which it is possible to analyze possible ignition and/or propagation points of fires. FRP (Fire Radiative Power) heat density map from which it is possible to identify the numerical sources of radioactive power of the fire (expressed in watts). Supervised classification (machine learning) NBR index (Normalized Burn Ratio). The data represents the results of a Random Forest classifier trained to classify the NBR index as of 4 October 2023 into four different categories, linked to fires based on their intensity. The classes identified include high-intensity fires, medium-intensity fires, low-intensity fires, and unburned areas. The overall accuracy of the model on test data is 63.98%. Supervised classification (machine learning) relativized index RBR (Relativized Burn Ratio). The data represents the results of a Random Forest classifier trained to classify the RBR index as of October 4, 2023 into four different categories, related to wildfires based on their burn severity. The classes identified include high-severity fires, medium-severity fires, low-severity fires, and unfired areas. The overall accuracy of the model on test data is 93.14%.
note: (the NBR index composite maps and related supervised classification have been removed after careful verification of the adequacy of some results).
- Calculation of the post-fire NBR (Normalized Burn Ratio) index on the burned areas. Calculation of the RBR (Relativized Burn Ratio) index for 2023 and 2022, relativized version of the dNBR (difference Normalized Burn Ratio) index. The index returns the periodic burn degree of the burned areas and is obtained from the following formula:
RBR = (NBR(pre_fire)–NBR(post_fire))/( NBR(pre_fire) 1.001).
The value of 1.001 in the denominator ensures that the equation never produces infinite values when pre-fire NBR values tend towards zero in areas with low vegetation cover or areas affected by fire.
The color scale used is the one proposed by the USGS for classifying the intensity level of the areas affected by fire.
Atmospheric data useful for forecasting/prevention activities for the 2024 season
- Seasonal average calculation for the period 11 July to 1 October 2023 of the standardized precipitation index (SPI) capable of measuring the anomaly in the amount of precipitation during a specific period. Negative values may indicate drought.
The severity levels of wet and dry events are defined according to the following table (McKee et al., 1993; WMO, 2012):SPI ≥ 2.0 = Extreme Humidity1.5 ≤ SPI < 2.0 Severe Humidity1.0 ≤ SPI < 1.5 Humidity moderate–1.0 < SPI < 1.0 Normal–1.5 < SPI ≤ –1.0 Moderate Drought–2.0 < SPI ≤ –1.5 Severe DroughtSPI ≤ –2.0 Extreme Drought
The index is based on 25 km interpolated data from the JRC's MARS Crop and Weather Monitoring project. The data is updated every 10 days, thus providing a more current view of the indicator compared to the classic end-of-month calculation. However, the accrual periods remain monthly, with monthly windows (28, 29, 30 or 31 day periods) starting on the 1st, 11th and 21st of the month. The SPI calculation method is still provisional and could be updated.Credits: Copernicus GDO (Global Drought Observatory) Emergency Management Service.
- Seasonal average atmospheric temperature calculation over 77 days (18 July to 4 October 2023). Maximum temperature interpolated daily using approximately 4000 weather stations across Europe and surrounding areas. The data is interpolated using an inverse distance algorithm that searches for stations within 200 km of distance. Up to a maximum of 20 stations are considered. A correction for elevation is made using a factor of 0.65 degrees Celsius per 100 meters. Interpolation is performed on a grid of 0.25 decimal degrees.Lavaysse, C., C. Cammalleri, A. Dosio, G. van der Schrier, A. Toreti, and J. Vogt. 2018. Towards a monitoring system for extreme temperatures in Europe. Natural Hazards and Earth System Science, 18, 91-104. https://nhess.copernicus.org/articles/18/91/2018/
Immagini satellitari Copernicus considerate: Sentinel-2B / 11-LUG-2023 / MSI_Level-2A - Sentinel-2B / 09-sett-2023 / MSI_Level-2A Sentinel-2B / 11-LUG-2023 / MSI_Level-2A - Sentinel-2B / 16-LUG-2022 / MSI_Level-2A - Sentinel-2B / 31-LUG-2023 / MSI_Level-2A - Sentinel-2B / 10-AGO-2023 / MSI_Level-2A - Sentinel-2A / 25-AGO-2023 / MSI_Level-2A - Sentinel-2B / 09-SET-2023 / MSI_Level-2A - Sentinel-2A / 04-OTT-2024 / MSI_Level-2A - Sentinel-2A / 16-FEB-2024 / MSI_Level-2A - Sentinel-2B / 15-AGO-2022 / MSI_Level-2A - Sentinel-1A IW Level-1 SLC Product / 30giu-12lug2023
Heat wave risk analysis
- Calculation of the average earth surface temperature (LST on Landsat data) aimed at analyzing the risk of heat waves for populations. Municipal centroids and calculation of population density per km2 on ISTAT 2023 data. LST MODIS for 12 images (from 18 July - 4 October 2023) and seasonal average of the Earth's surface temperature during the day with a resolution of 1 km (in legend °C - Kelvin metadata). The LST-MODIS images of the Vulture Alto Bradano (Basilicata) of 2023 were downloaded on February 3, 2024 from https://appears.earthdatacloud.nasa.gov, operated by the NASA EOSDIS Land Processes Distributed Active Archive Center (LP DAAC) at the USGS Earth Resources Observation and Science (EROS) Center, Sioux Cascades, Dakota South. 2018, https://lpdaac.usgs.gov
- Calculation of the LST (Land Surface Temperature) index of the radiant temperature of the earth's surface in the Basilicata region.
Satellite image considered for 2022: Landsat-9 (USGS-NASA) OLI_TIRS_L1TP from 2022-07-23 with 1% cloud cover.
Satellite image considered for 2023: Landsat-8 (USGS-NASA) OLI_TIRS_L1TP from 07-18-2023 with 1.5% cloud cover.
LST index calculation procedure from Landsat images with 30 m/px resolution:
1) calculation of the TOA (Top of Atmosphere) reflectance with the red and near-infrared bands;
2) TOA Brightness Temperature calculation for the thermal band;
3) calcolo dell'indice NDVI (Normalized Difference Vegetation Index);
4) estimate of the vegetative proportion and emissivity of the Earth's surface;
5) LST (Land Surface Temperature) index calculation;
6) supervised semi-automatic classification (Machine Learning)
How can this index be useful?
a) Urban microclimate: heat island calculation to counteract summer heat waves.
b) Agriculture: study of evapotranspiration in the irrigation sector, monitoring of soil conditions.
c) Pollution or industrial accidents: monitoring of water and soil quality.
d) Forest fires: areas at greatest risk and evaluation/estimation of trigger points, comparison with the indices on the areas affected by the fire.
e) Geology: geomorphological monitoring, estimation of landslides and earthquakes.
f) Hydrological engineering: study on water flow.
The project to calculate the LST index of the Basilicata Region was possible thanks to participation in the seminar "GIScience for mapping the urban microclimate: heat islands in Padua" on 6 July 2022 organized by the University of Padua in collaboration with the Climate Justice Center of Excellence Jean Monnet and the GIShub association.
Biogeophysical products of the earth's surface (forests and woodlands)
- NDVI (Normalized Difference Vegetation Index) calculationThe Normalized Difference Vegetation Index (NDVI) is an indicator of the greenness of biomes. Although it is not a physical property of vegetation cover, its very simple formulation NDVI = (REF_nir – REF_red)/(REF_nir REF_red) where REF_nir and REF_red are the spectral reflectances measured in the near-infrared and red bands respectively, makes it widely used for ecosystem monitoring. LAI (Leaf Area Index) calculationThe leaf area index is defined as half of the total area of green elements of the canopy per unit of horizontal land surface. The satellite-derived value corresponds to the total green LAI of all canopy layers, including the undergrowth which can represent a very significant contribution, particularly for forests. In practice, the LAI quantifies the thickness of the vegetation cover. The LAI is recognized as an essential climate variable (ECV) by the Global Climate Observing System (GCOS). FAPAR (Fraction of Absorbed Photosynthetically Active Radiation) calculation The FAPAR quantifies the fraction of solar radiation absorbed from living leaves for photosynthesis activity. Therefore it refers only to the green and living elements of the foliage. FAPAR depends on the structure of the canopy, the optical properties of the plant elements, the atmospheric conditions and the angular configuration. To overcome this last dependence, a daily integrated FAPAR value is evaluated. FAPAR is recognized as an essential climate variable (ECV) by the Global Climate Observing System (GCOS). FCover (Fraction of green Vegetation Cover) calculation The Fraction of Vegetal Cover (FCover) corresponds to the fraction of land covered by green vegetation. In practice it quantifies the spatial extent of vegetation. Since it is independent of the direction of illumination and is sensitive to the amount of vegetation, Fcover is an excellent candidate for replacing classic vegetation indices for ecosystem monitoring.
Copernicus satellite images considered: Sentinel-2B / 16-FEB-2024 / MSI_Level-2A
Carbon tanks
- Vegetative canopy height [by Lang, N., Jetz, W., Schindler, K., & Wegner, J.D. (2023). A high-resolution canopy height model of the Earth. Nature Ecology & Evolution, 1-12]: Developed a probabilistic deep learning model to recover canopy top height from Sentinel-2 images. This model, an ensemble of convolutional neural networks (CNNs), was trained with sparse supervision using canopy-top height data derived from NASA's GEDI full-waveform LIDAR (i.e. RH98 estimated by Lang et al., 2022 ). The predictive uncertainty of these dense estimates is quantified by modeling both the data uncertainty (random uncertainty) and the model uncertainty (epistemic uncertainty). The ETH Global Canopy Height 2020 product is provided free of charge, licensed under the Creative Commons Attribution 4.0 International License.
Project n.2
GeoMorphoGuard
(click on the image)
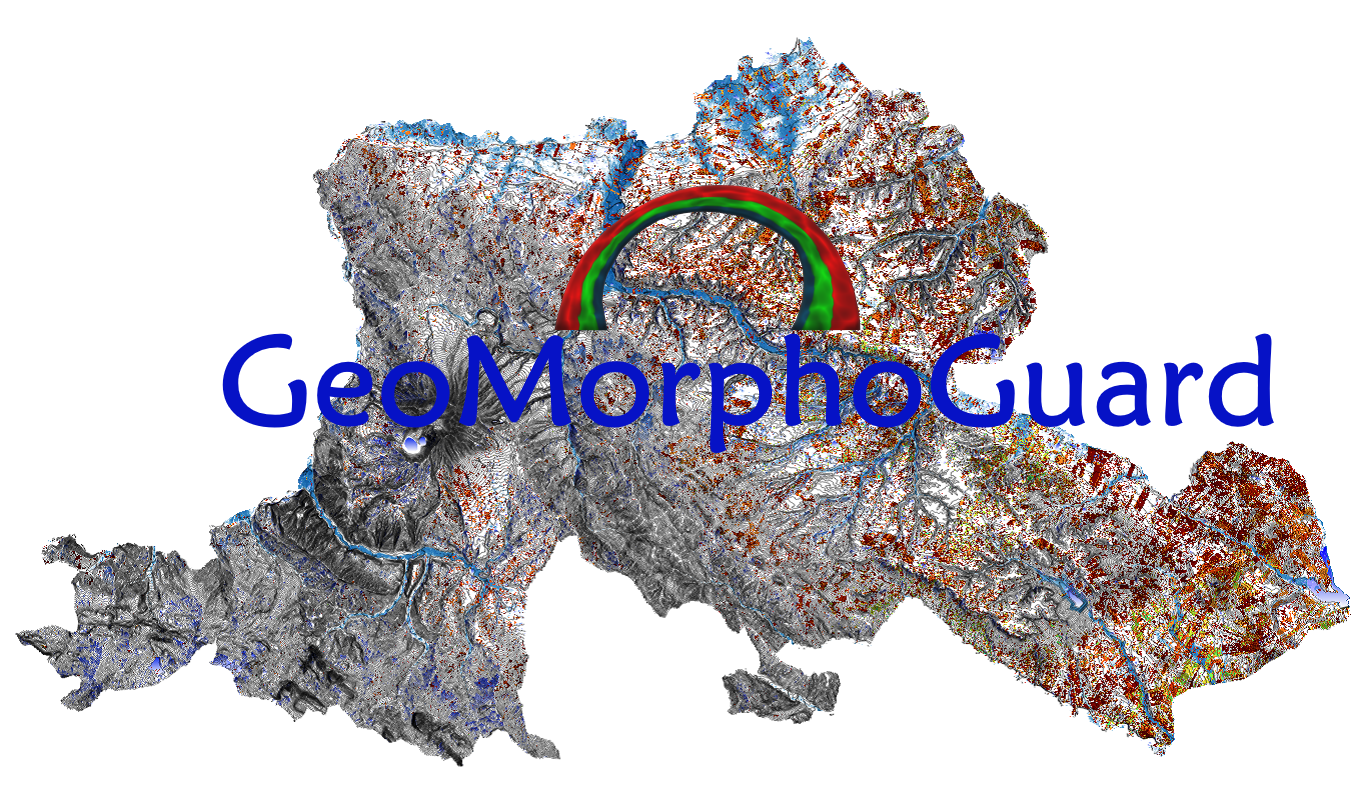
Continuing to provide increasingly updated data on natural and anthropogenic risks caused by the climate crisis, the second project called GeoMorphoGuard was born, the open data service for monitoring and protecting areas at hydro-geomorphological risk, through the use of DTM products ( with 5 m resolution) made available by the RSDI Geoportal of the Basilicata Region, Sentinel-1 active remote sensing (interferometric and non-interferometric products) and Sentinel-2 passive remote sensing of the Copernicus program.
The increasingly frequent extreme meteorological events require hydro-geomorphological monitoring of the territory at risk. It was decided to continue monitoring the Vulture - Alto Bradano area (North Basilicata). To support the forecasting and prevention activities, hydrological analysis was carried out, the calculation and analysis of the history of the flooded areas, the processing of the data of the PAI (Hydrogeological Structure Plan) for the Puglia Regional UoM and the Basilicata Regional UoM.
In the implementation phase, the processing of data relating to soil humidity, biomass change, hydrological analysis, estimation of interferometric coherence, "relative" and "absolute" deformation from which the possibility of calculating the millimetric displacements of the soil in order to obtain an updated mapping of soil changes. Integrated data sets on the composite supervised classification of RBR index and urban footprint with relative differences in back scatters.
Hydro-geomorphological danger and risk (before)
- Hydrological analysis of 95 DTM (Digital Terrain Model) sheets where the water drainage networks or channels, the water nodes, the direction of the floods and the drainage basins were calculated. Furthermore, the contour lines or isoipses (at 10 m), the shaded relief, the slopes and the roughness of the soil were calculated. Processing of 7 Sentinel-1 SAR satellite images of the Copernicus program, for the 2016, 2018 hydrological annals , 2019, 2020 and 2021 of the Civil Protection of the Basilicata Region. Having analyzed the rainfall data of the months with the most significant rainfall, the satellite images of the period were subsequently processed. For 2022, a meteorologically extreme event in March was considered which affected the area between Venosa and Palazzo San Gervasio, for 2023 a flood event which affected the Basento river (but outside the study area). The final product returned the "flood coverage" mapping from which it is possible to visualize the most significant floods, but also the recharge areas of the drainage basins. Calculation of the difference in annual water supply and soil moisture (January 2018 - January 2019) processed from two Sentinel-1 SAR satellite images with VV polarization (vertical polarization of the emitted and received signal) from which backscatter (signal intensity) is lower in the presence of water/humidity. The final interferometric product returns an RGB image from which it is possible to view the variation in soil humidity and the flooded areas compared to the previous year, taking into account the greater rainfall that occurred in January 2019 compared to 2018 in the same period. Unsupervised classification of the RGB interferometric image (January 2018 - January 2019) with the KMeans-Classification algorithm to determine correlated pixels of flooded areas "flood mapping". The use of machine learning has returned a product useful for predicting potentially floodable areas in the event of extreme meteorological events. Calculation of the SAGA humidity index, similar to the topographic humidity index (TWI), of a modified river basin (Modified Catchment Area) with DEM (Digital Elevation Model) produced by Sentinel-1A. Cells located in valley bottoms with a small vertical distance from a channel provide a more realistic and higher potential soil moisture than standard TWI. The calculation of this index, thanks to specific SAGA algorithms, is useful for forecasting potentially floodable areas in the event of extreme meteorological events which, in this case, returned 5 (five) expected scenarios. Calculation and analysis of deformation/changes ( displacement_VV) multi-temporal "absolute" ground surfaces (LOS) expressed in m (meters), with coherence values > 0.8 from n. 7 pairs of interferometric satellite images (InSAR). With coherence values close to 1 it is possible to identify the anomalies provided by the phase maps (interferometric image pair difference). Negative values indicate moving away from the satellite (sensor-target line), positive values indicating approaching. The analysis concerned the Vulture Alto Bradano area and is a first approach to identify possible landslides. Change detection: Calculation and multi-temporal analysis of the NDWI index (Normalized Difference Water Index) to identify changes in the humidity of the soils in areas affected by fire, in drainage basins, in areas historically subject to flooding. Calculation and multi-temporal analysis of the NDVI index (Normalized Difference Vegetation Index) to identify changes in agro-forestry biomass (areas affected by fire, forestry operations , agricultural activities). Supervised classification (machine learning) relativized index RBR (Relativized Burn Ratio). The data represents the results of a Random Forest classifier trained to classify the RBR index as of October 4, 2023 into four different categories, related to wildfires based on their burn severity. The classes identified include high-severity fires, medium-severity fires, low-severity fires, and unfired areas. The overall accuracy of the model on the test data is 93.14%. Calculation of the urban footprint from inSAR images, with a time span of five years, for the identification of changes based on the amplitude images and the estimation of interferometric coherence. In the representation of the RGB composite (not present on WebGIS, but available on request), the red color band channel indicates coherence, green the average of the back scatter (back dispersion) and blue the difference. Individual band channels can be interpreted based on coherence and dispersion, to identify changes in urban and peri-urban, agricultural, forestry and industrial areas. Very useful for a comparison with land use maps also for the purposes of updating them.
Immagini satellitari Copernicus considerate: Sentinel-1B IW Level-1 GRD Product / 27sett2016 - Sentinel-1A IW Level-1 GRD Product / 27mar2018 - Sentinel-1B IW Level-1 SLC Product / Descending / 22dic2018 - Sentinel-1B IW Level-1 GRD Product / 27gen2019 - Sentinel-1B IW Level-1 GRD Product / 10gen2020 - Sentinel-1B IW Level-1 GRD Product / 28gen2021 - Sentinel-1A IW Level-1 GRD Product / 06mar2022 - Sentinel-1A IW Level-1 GRD Product / 24gen2023 - Sentinel-2B / 11lug2023 / MSI_Level-2A - Sentinel-2B / 9set2023 MSI_Level-2A - Sentinel-2A / 4ott2023 / MSI_Level-2A - Sentinel-1A IW Level-1 SLC Product / 28ago2023 - Sentinel-1A IW Level-1 SLC Product / 09sett2023 -Sentinel-1A IW Level-1 SLC Product / 21sett2023 - Sentinel-1A IW Level-1 SLC Product / 03ott2023 - Sentinel-1A IW Level-1 SLC Product / 15ott2023 - Sentinel-1A IW Level-1 SLC Product /27ott2023 - Sentinel-1A IW Level-1 SLC Product / 08nov2023 - Sentinel-1A IW Level-1 SLC Product /20nov2023 - Sentinel-1A IW Level-1 SLC Product / Descending / 14dic2023

| SATmonitoring by Vito L'Erario |
P.Iva 02152550766
CF LRRVTI73R13L738C
Sole proprietorship registered in the Basilicata Chamber of Commerce Register of Companies No. REA PZ-213326
Concessionary measure: Microcredit A, contribution granted €23,390.00
The operation was carried out with the support of the European Union through the European Social Fund (ESF) as part of the OP ESF Basilicata 2014-2020
Received subsidy of €23,390.00, company in flat-rate accounting regime